Module 4: Evaluation Approaches
4.1. How to think about evaluation for GBV prevention
Modules 1-3 covered a number of critical issues for GBV prevention program design and measurement. Underpinning all of these issues are some core challenges that organizations face when trying to understand what works in GBV prevention in humanitarian contexts:
- Complexity: gender-based violence is in itself a complex phenomenon. It is impacted by a wide range of driving and contributory factors, ranging from macro-level factors like the underlying inequalities of gender and identity across a society, to very micro-level issues such as the specific power dynamics within a particular household. Preventing GBV from occurring is best understood as a “non-linear” process. In other words, we should not expect a clear and simple relationship between the amount of time and resource invested and outcomes in terms of reduced GBV. Nor should we expect to know how change will happen before it does: we need to be open to the possibility of unintended consequences on the pathway to change.
- Time: humanitarian teams often have very limited time during project design stage. As noted in Modules 1-3, this is partly due to the short timeframe between funding requests being launched and the deadline for proposal submission. But beyond this, funding cycles of 6-12 months will always challenge the ability of project teams to observe and demonstrate change in GBV incidence and risk within a single project life-span.
- Privacy: as highlighted in Module 3, even when data can be collected, it is often difficult to share sensitive case-data, or any data that could reveal the identity of vulnerable groups. This makes it difficult for M&E teams to directly engage in data collection and analysis.
The evaluation tools and methods used to measure change need to be responsive to these constraints. For this reason, the tools presented in this Module have been selected on the basis of their ability to overcome these challenges. In particular, the following criteria have been used to help identify potential tools:
Criteria |
|
| 1. | Helps team monitor community-based behavior change |
| 2. | Open to unintended consequences and interactions between different program components |
| 3. | Participatory in nature, encouraging community-based data collection and evaluation wherever possible |
| 4. | Supports learning about how the program interacted with external factors in bringing about change |
| 5. | Can be implemented in coordination between program and M&E teams, including where primary data collection needs to be done by program staff |
It should be noted that many evaluation tools could be used or adapted to meet these criteria. The list presented below is by no means exhaustive in this regard. Program teams are encouraged to use these criteria to make their own selections, including by using tools not presented in the list below.
4.2. Sample tools and approaches
This section presents a sample of evaluation tools and approaches of potential use for GBV prevention programs. The tools have been selected on the basis of their ability to respond to the criteria outlined in section 4.1 above. It is worth noting that each tool requires a different type of engagement, and a different level of investment from the organization and community. As such, it is important to consider which tool is most relevant for the project you are working on. The following design tree is intended to help program and M&E teams choose the right approach or method for their context:
Diagram 7: A Decision-Tree
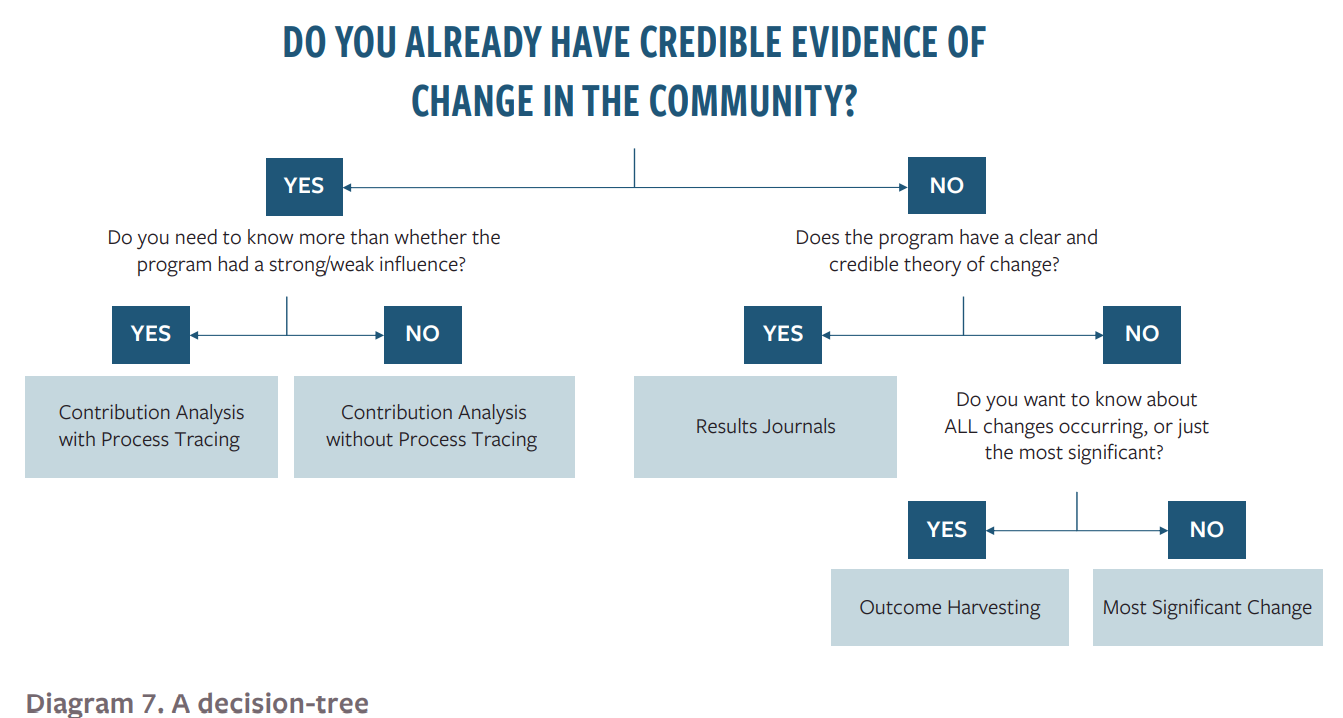
Lastly, it should be noted that no single tool can ever provide the entire solution for an M&E problem as complex as GBV prevention. Organizations are encouraged, therefore, to pick and choose, mixing different approaches where necessary, and adapting them to fit the needs and constraints faced by project teams.
4.2.1. Results journals
What it is:
An results journal is a tool for collecting data about behavior change over time. What makes it a journal is the use of a community-based record of changes over time. What makes it an results journal is the focus on behavior changes within the community itself; rather than recording progress in delivering a program or set of activities.
Typically, an results journal will help you to track the ultimate behavior change you are seeking to bring about, such as a reduction in IPV among migrant households in a refugee camp. But it will also help you measure the steps in the pathway to that change within the community, such as the improved awareness of IPV risk and change in underlying beliefs about IPV among the wider population. In this way, results journals are a great way to measure the types of progress markers identified in Module 3.
Results journals are one of the standard monitoring and evaluation tools deployed by outcome mapping approaches to measure complex change within a population, community or institution. As outlined in Module 3, this framework recommends the use of a streamlined version of outcome mapping, so as to fit within the constraints of humanitarian programming, whilst still benefitting from many of the insights outcome mapping can provide. Within this streamlined version, results journals are the primary means for collecting data about results-level change.
How to use it:
The first step to designing a results journal is deciding who can complete the journal for you. Ideally, the journal will be completed by the boundary partners identified in Module 3. If so, these partners will be members of the community being served, who have the potential to influence change in the wider community over time. As such, the first step in using a results journal will normally include some training or capacity building with the project boundary partners, in order to make sure the journals are used as intended. In some cases, it will not be possible to ask community members to complete results journals. Organizations consulted for this framework cited the following challenges:
- Risk of doing harm by asking community members to record information about GBV
- Transient population groups, such as migrant communities, making it impossible to identify community members who can record journals over time
- Low literacy rates in the community
In these cases, it is preferable to identify program team members, such as caseworkers or community outreach teams, who have a high degree of trust within the community and a steady presence over time.
The next step is to build a timetable for collecting journal entries. This needs to be done on the basis of the program timeline and the most realistic expectations for the changes identified in the program progress markers.
Lastly, the journal itself needs to be designed and a format agreed for its completion by the program boundary partners. Journals can take many different forms, and the following options present two of the most common. More examples can be found at the online outcome mapping learning hub: https://www.outcomemapping.ca/
Program example:
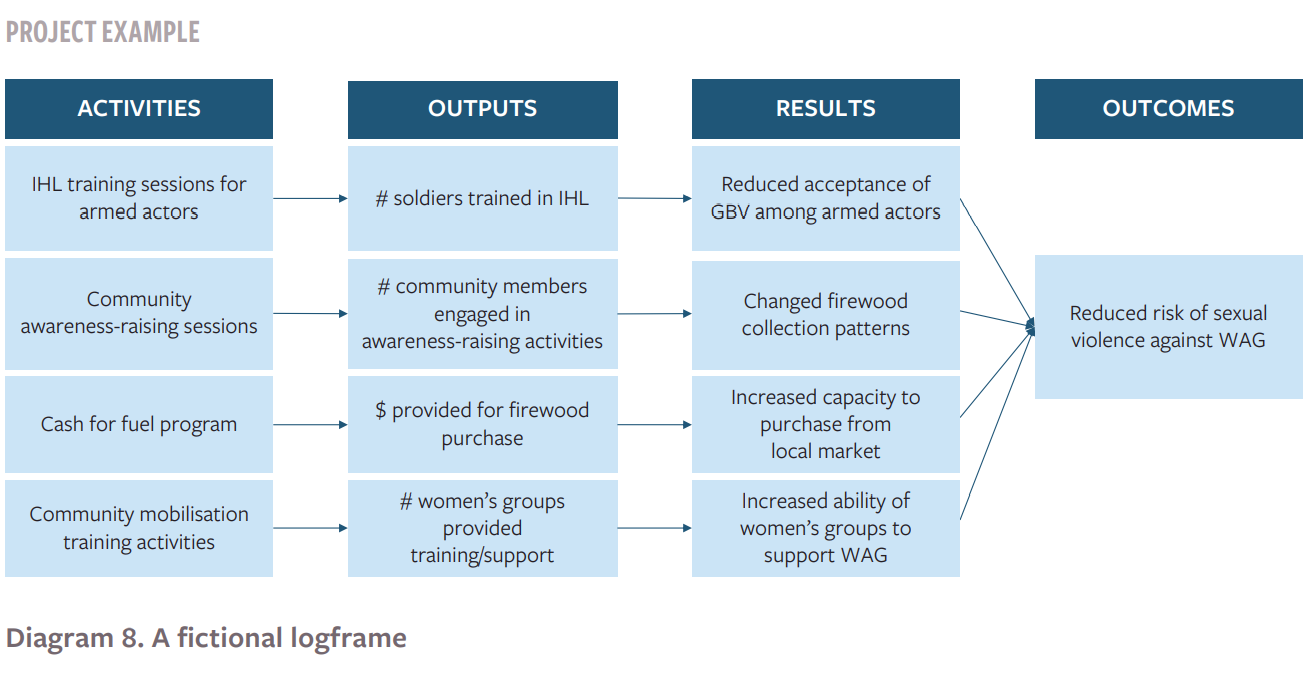
Recall the fictional project presented in Module 3 of a project working on the risk of sexual violence faced by IDP women and girls in an IDP camp setting. The project logframe included a range of activities and expected results across different components of the risk profile:
Diagram 8: A fictional logframe
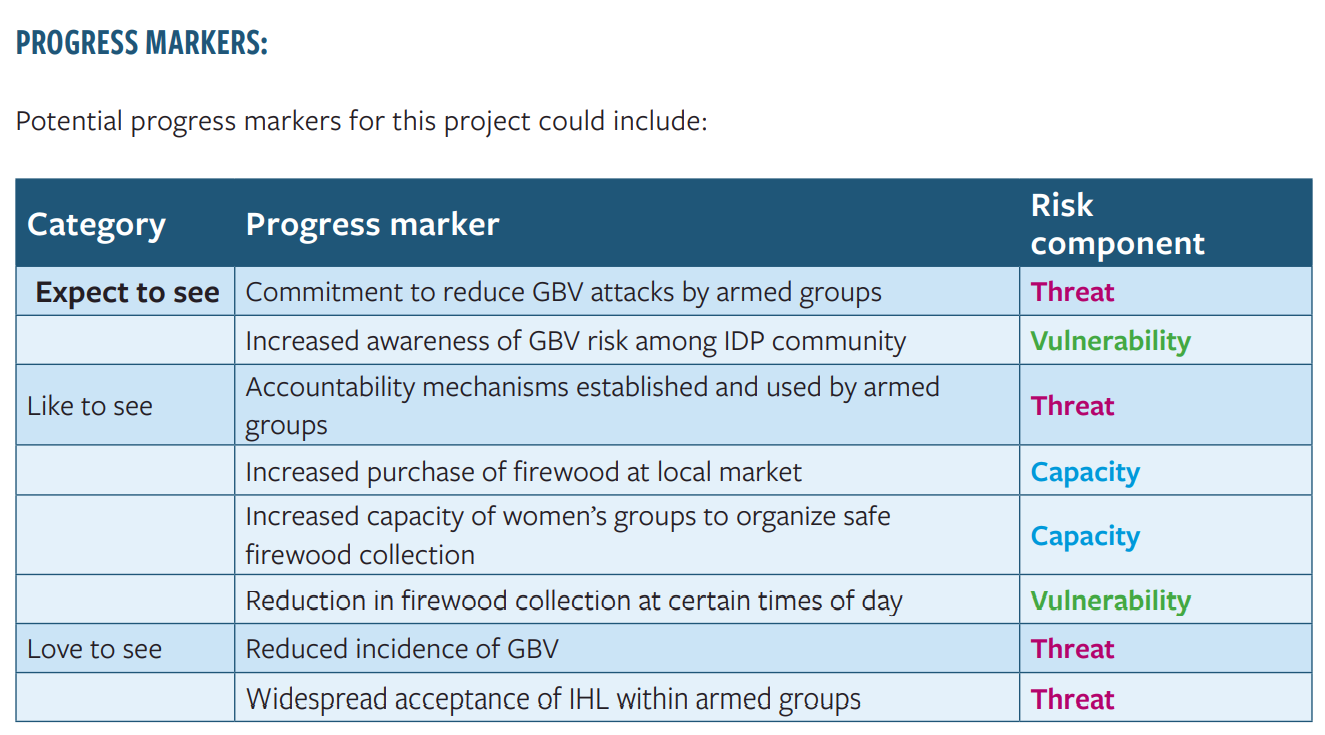
Progress makers:
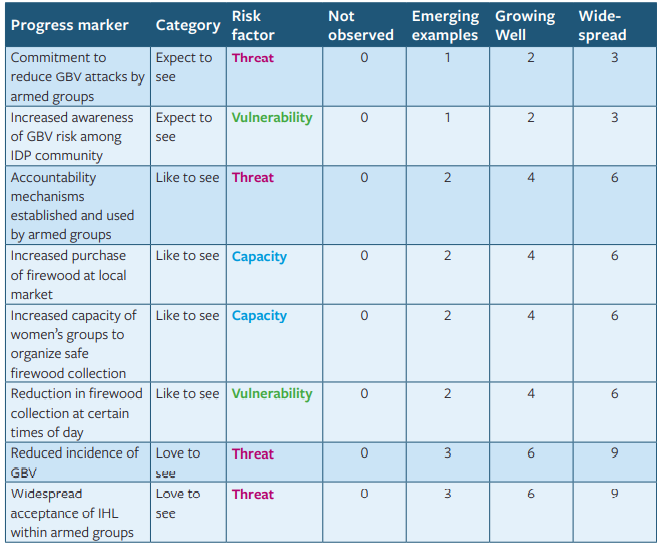
Potential progress markers for this project could include:
Results journal format 1:
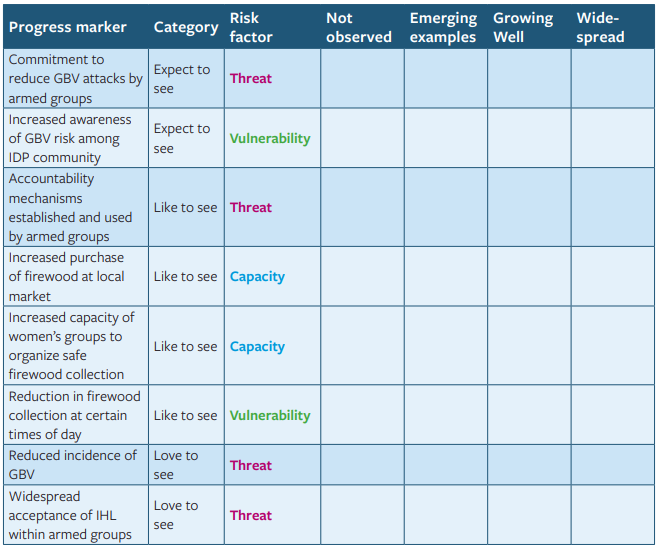
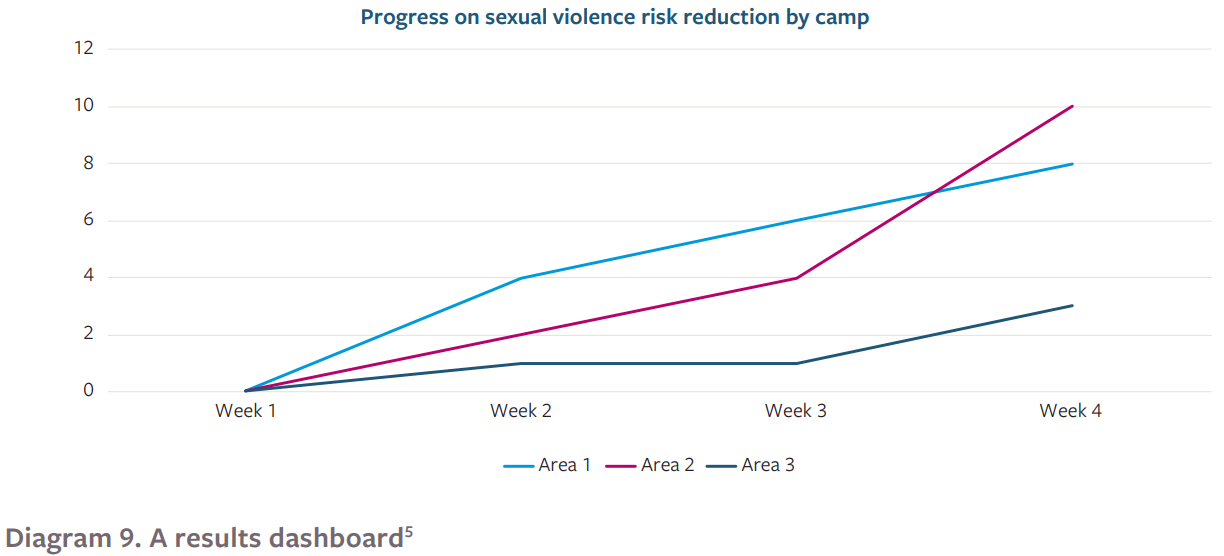
Journals like this can be used to record quantitative data over time and across different areas. For example, the program might ask the journal collectors to record examples of the behaviors listed above every week over a six-month period. By weighting the scoring appropriately, the team can notice when the changes are most widespread, and when the “love to see” changes are occurring:
This information can then be used to generate a clear and simple dashboard, mapping progress in different over time, potentially across multiple IDP camps or areas:
Diagram 9: A Results Dashboard
Results journal format 2:
A more open-ended tool for collecting data about this same program could also be used. For example, the following format allows boundary partners to collect information from community members that may not otherwise be recorded:
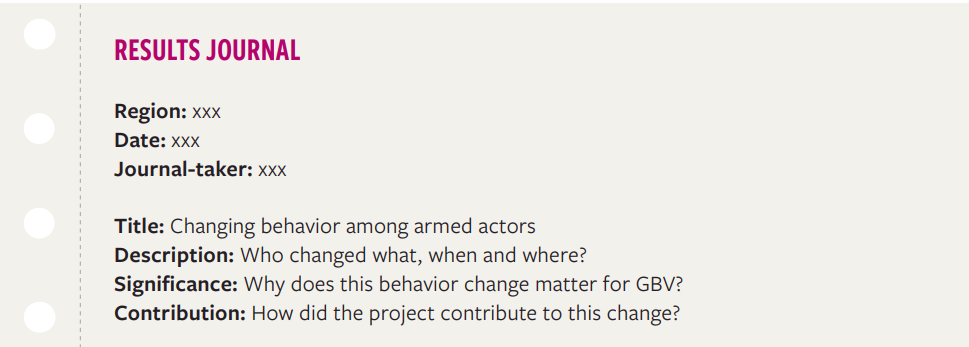
For example, in the fictional example presented in Diagram 8 above, an open-ended journal record could look like this:
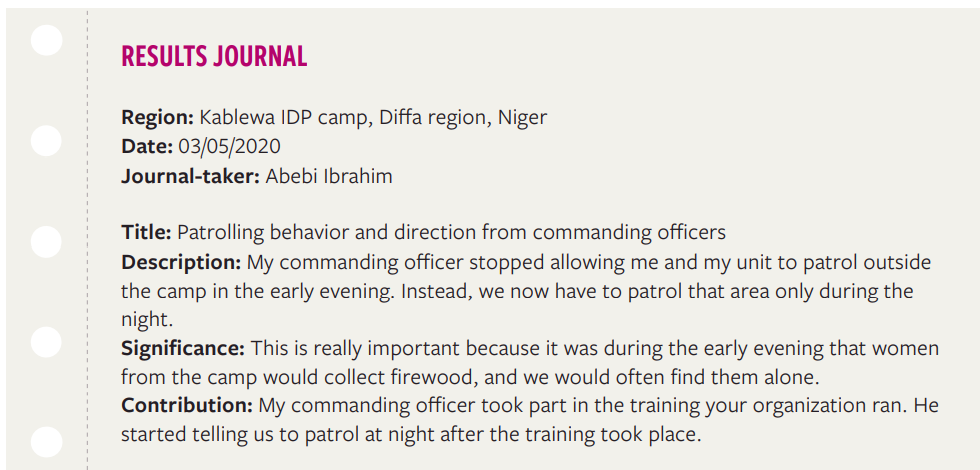
This type of tool is particularly powerful at measuring unexpected changes in the community, precisely because it asks an open-ended question. The importance of asking the community-member to tell you about the significance of change cannot be understated: by doing this, you are giving the community an opportunity to tell you about changes that you would not otherwise connect to your program activities.
4.2.2. Outcome harvesting
What it is:
Outcome harvesting is a monitoring and evaluation technique designed to capture clear examples of change in the community, and then work backwards to assess the contributions of a project or program towards that change. It is closely related to outcome mapping (described in Module 3) but distinct from it.
The major value of this technique to GBV prevention is the ability of outcome harvests to provide robust data about results even when the initial program design is unclear, or when the project evolved significantly from its original design. As noted in Vigaud-Walsh (2020) and discussed in the Introduction and Module 1 of this framework, many GBV prevention programs are designed without clear, transparent and context-specific theories of change. In situations like this, it can be difficult to use evaluation tools that rely on a clear project-level theory of change. As such, outcome harvesting has particular value in this context.
In addition to this, outcome harvesting has a number of benefits that are of relevance to GBV prevention work, including:
- It treats all observed outcomes equally, rather than prioritizing the intended outcomes at project design stage. This makes it especially good at capturing unintended outcomes, such as the impact of a program that aims to prevent intimate partner violence on other forms of gender-based violence or wider social norms change.
- It is typically emphasizes a democratic approach to observing community-based change, whereby observations made by community members are treated equally to those made by program teams or direct partners of the implementing organization. This makes it useful when you are seeking to understand how the program has effected a diverse group of people within the community, who may have a collection of diverging, or even contracting, perspectives on the effects of the program and who may observe changes that the program team cannot see.
- It is especially useful in complex program contexts, where the causal mechanism underpinning the changes observed is not fully understood. In situations like this, it can prove difficult to use evaluation approaches that seek to measure activities first, then outputs, then results, then outcomes; since direct causes of the outcomes observed remain unclear. For outcome harvesting, this is less of a challenge since it starts with the observed outcome itself, rather than the mechanism that caused it (although this can still make it difficult to assess program contribution to change).
How to use it:
Outcome harvesting was originally designed for international development contexts. As such, it can be quite time and labor intensive when done in these contexts. One well-known example was the Oxfam Novib evaluation of its global program between 2005 and 2008, which captured a total of 200 distinct outcomes. This level of effort is unlikely to be possible within the context of GBV prevention projects in humanitarian settings. As such, this framework presents a shortened version of the outcome harvesting tool, which is intended to encourage teams to capture outcomes as widely as is realistic given the timeframes and resources available. For a full presentation of the original method, please see:
- Wilson-Grau, R. and Britt, H. (2013). Outcome Harvesting. Ford Foundation.
- Wilson-Gray, R (2015). ‘Outcome Harvesting’. Better Evaluation. https://www.betterevaluation.org/plan/approach/outcome_harvesting
Irrespective of timeframes, outcome harvesting is typically conducted by M&E teams who have a degree of independence from the program implementation. This is important because the aim is to collect a wide-range of observed changes without preferencing those the program team intended to bring about. It can be integrated into program monitoring during implementation, or alternatively conducted at the program-end. It is also quite flexible when it comes to specific data collection tools: outcome harvests can be done well using individual interviews, focus groups or surveys.
The outcome harvesting approach presented in this framework uses five key steps:
- Step 1: Design the harvest
- Step 2: Gather data and perceptions
- Step 3: Substantiate the outcomes
- Step 4: Analyze and interpret
- Step 5: Support the use of findings
Step 1: Design the harvest
The first step is to design the outcome harvest. This involves two elements:
1. Deciding which questions to ask
Using the example outlined in Module 3 that sought to reduce the risk of sexual violence against IDP women and girls by armed actors, this could include the following questions:
- What has been the result of the program’s activities on the behavior of armed actors towards women and girls in this community?
- How has the program improved the ability of women and girls in the IDP community to meet their basic needs without fear of sexual assault by the armed groups outside the camp?
- How have the different parts of the program worked together to tackle the full range of the risk profile present in this community?
It is important that these questions are designed in collaboration with the main users of the evaluation. In this case, that is most likely to be the program team and the organization’s country GBV advisors. In some cases, it may also include donors or community-members, but only where they will have a realistic avenue for using the evaluation findings to bring about positive change.
2. Deciding what information will be collected in order to answer the questions
Once the questions have been decided, the evaluators will decide what types of information will be collected in order to answer them. Critically, this must include:
The outcome descriptions: what factors (e.g. behaviors, beliefs, practices or norms) have changed since the program began? How do these factors link to the threats, vulnerabilities and capacities identified in the GBV risk analysis? In who have these factors changed (e.g. armed actors, IDP women and girls, IDP men and boys)? When and where did these factors change? What is being done now that was not done before the program?
The contribution of the program: how (if at all) did the program influence this change? What did they do that helped to bring this change about?
Step 2: Gather data and perceptions
The evaluator will then review available data and, where necessary, conduct primary data collection for evidence of outcomes and program contributions. The emphasis here is on casting a wide-net for observed changes, rather than limiting the data to expected changes related to the program. This could include reviewing program monitoring reports, needs analyses, or any other program data capturing behaviors within the community. It could include program data from other programs conducted at the same time as the program being evaluated, which may reveal unintended consequences on other areas of community life. It could also include interviewing community members and program teams where necessary, but it remains important to ensure that “Do No Harm” principles are prioritized in this case.
Once the data is reviewed, the evaluator will draft outcome descriptions for each outcome observed – and there would normally be multiple outcomes for any given project or program – along with any evidence of the contribution of the program. These descriptions can be kept short, and may simply focus on presenting what changed, for whom, and when. For example:
| Outcome Description | ||
| Outcome | The armed actors slowly stopped patrolling areas close to the IDP camp during firewood collection hours. This first started to change two weeks after the program began, with a small reduction in patrols. By the time the program finished, patrols were only taking place at night. | |
| Contribution | The program conducted IHL training with the armed actor groups, highlighting the potential consequences of committing sexual violence on IDP community-groups. Senior soldiers reported fearing the consequences of allowing their units to commit sexual violence, and indicated they had instructed them to change patrol schedules. |
Step 3: Substantiate the outcomes
In this step the evaluator and the program teams review the outcome descriptions and select a sample to verify. To verify the selection, the evaluator should try to interview stakeholders who are independent of the program and the organization itself, but who know about the activities of the program. IDP community leaders, for example, or women and young girls who collect firewood in the IDP community, would be well-placed to verify outcome statements in this project example. Likewise, where possible, members of the armed group who took part in awareness-raising activities might be approached if no risk of harm is presented.
Step 4: Analyze and interpret
The evaluator then analyzes and interprets the findings of the outcome statements and contribution analyses, and seeks to group and classify them into thematic areas. A good way to do this is to classify the outcomes according to the risk equation, e.g:
Threat |
Vulnerability |
Capacity |
| The armed actors slowly stopped patrolling areas close to the IDP camp during firewood collection hours. | The women and girls began collecting firewood in large groups of mixed ages. | The IDP households decreased firewood collection and increased firewood purchase in the local market. |
Once this is done, the evaluator should interpret the information and seek to answer the harvesting questions identified in Step 1.
Step 5: Support the use of findings
Finally, the evaluator should discuss the conclusions with the primary harvest users, in this case, the program teams and country-based GBV advisors; as well as the community members themselves. The evaluator should present the major answers to the harvest questions, as well as the outcome statements and contribution analyses, highlighting any areas of unintended consequences or information that the program team may not be aware of. The discussion should aim at identifying lessons and avenues for further improving the program or adapting it during the next project cycle; as well as providing an additional space for community feedback.
4.2.3. Most Significant Change
What it is:
Most significant change (MSC) is a method for asking about change in the community. It is an indicator-free approach, which is typically used when you don’t know what the results of your program will be, i.e. when unintended consequences are common and important. One of the core principles of MSC is to give communities an opportunity to describe how the program impacted their lives. As such, it can provide a powerful way to increase community feedback on program effects.
Much like outcome mapping, MSC was designed in the context of development interventions in relatively stable contexts. As such, this framework has identified a streamlined approach to help humanitarian teams implement MSC in time-constrained contexts. For more details of the full MSC approach, please see the original MSC guidebook: https://mande.co.uk/wp-content/uploads/2018/01/MSCGuide.pdf
How to use it:
There are 5 steps to the streamlined MSC approach in this framework:
- Step 1: Identify the domains of change
- Step 2: Collect the stories of change
- Step 3: Select the most significant changes
- Step 4: Provide feedback
- Step 5 (optional): secondary analysis
Step 1: Domains of change
This step involves identifying the 3 -5 areas that the program is trying to bring change to. This may relate to the components of risk, for example:
- Behavior of soldiers towards civilians (threats)
- Attitudes of soldiers towards gender-based violence (threats)
- IDP experiences and perceptions of soldiers in their area (vulnerabilities)
- IDP ability to mitigate the sexual violence risk themselves (capacities)
It’s important that these domains are kept “loose” and “fuzzy” in their definition. This helps you to collect stories that you could not necessarily predict at the time of project design. It’s also vital to make sure that the domains of change are within the communities being served. Don’t include things like “perceptions of our services” or “engagement in our activities”, as these are not program outcomes, as outlined in Module 3.
Step 2: Collecting the stories
This step involves collecting stories of change over time within the domains identified above. As with results journals, this can be done through boundary partners or team-members with a high degree of trust in the communities in question. There are many different ways to construct the story templates themselves, but a common approach is presented below:
COLLECTING THE STORIES
- Meta-Data:
Location, date, project (if relevant), period when story took place, profile of
storyteller (if appropriate)- Title of the story:
Ask your story teller to give it a name
- Question 1:
Tell me how you became involved in the GBV training program, and what your
current involvement is?- Question 2:
From your point of view, what is the most significant change that you’ve seen in your regiment as a result of the program over the last year?
- Question 3:
Why is it significant to you?
- Domain:
Enter the domain of change that this story is related to
This template allows the enumerator to collect basic information about the time and place were the story happened; a basic and open-ended question is asked about the most significant change observed by the interviewee. And, crucially, the significance of this story to the interviewee is then explained. This allows people to share stories that may not be obviously related to GBV, but which nevertheless demonstrate significance to it. For example, a soldier may report that, since taking part in a GBV awareness-raising session, his peers have stopped patrolling a certain area at night. It’s only by asking the significant of this change that we might discover those particular night patrols were being used for sexual violence against civilians. Lastly, the enumerator records the domain of change that this relates to, in this case, the behavior of soldiers towards civilians.
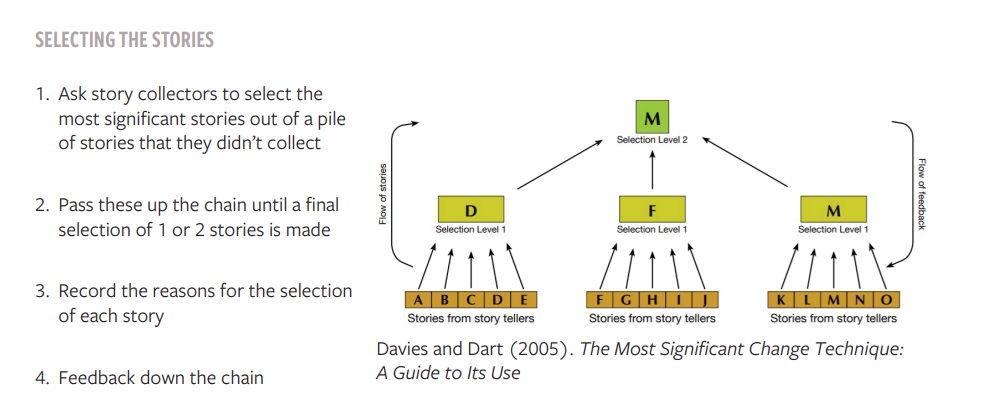
Step 3: select the most significant changes:
Once these stories have been collected from multiple sources by multiple enumerators, a process of selection can take place. This selection process can take many different forms, but a common one is for enumerators to select the 3-5 stories they collected that they consider to be most significant. Importantly, the enumerators would also record their reasons for this selection. Once all enumerators have done this, an M&E manager will often make a further reduction, based on the selection of stories presented to him/her. Again, the manager records the reasons for his/her selection. This process can continue up the organizational hierarchy until just 3-4 stories are left, signifying the most significant changes brought about by the program over time.
It is very important, however, to consider how this selection process takes place. GBV prevention activities in particular are inherently rooted in community perceptions, beliefs and norms. As such, it might not be useful to use the organizational hierarchy to filter stories of change in this way. Instead, the program team could ask different community members to make selections themselves, again, recording their reasons why. Non-hierarchical models can be used for this process.
As with all GBV data collection, the risk of causing harm by sharing stories such as this must be kept paramount in program teams’ minds. Where this is not possible without respecting the privacy of individuals involved, it must not be attempted. In such cases, it is advised that program teams select the most significant stories, not community members.
Step 4: provide feedback
Once the most significant changes have been identified, it is important to feedback to project teams on the ground and the community members themselves. This may involve, for example, sharing the fact that night patrols in one area were linked to GBV incidence. Sharing this information within the program team can help to improve programming by adjusting resources and activities to improve effectiveness in light of unexpected changes such as this. Sharing this information with other organizations doing similar work in the same context can also greatly add to the community-wide learning effort. And sharing information with the community can provide an additional space for validation of findings and community feedback.
Step 5 (optional): secondary analysis
This step is optional because it can add to the richness of learning at project closure but doesn’t necessarily add to adaptation and change during implementation. Typically, after the project has ended, a program or M&E staff member will undertake this activity. Essentially, it involves reviewing every story collected, including those cast aside as less significant. These are then mapped and coded by theme, for example “changes in armed actor movements” or “changes in power dynamics between household members”. They are also compared against the reasons for selecting the stories that were chosen as the most important. By comparing these, the reviewers can draw out key themes and learning about the program that may not have been captured during the implementation period. This can then be fed into future project design, e.g., by thinking about how armed actor movements relate to GBV incidence in future. It can also be used to help build the evidence about what works in GBV prevention, in what contexts, and for whom.
4.2.4. Contribution Analysis
What it is:
Contribution analysis is an analytical tool that helps teams understand how their activities influenced an observed change. It’s useful when you already have an outcome-level change clearly observed, and you are left with questions about how your program contributed to it. In these contexts, contribution analysis can help answer questions like:
- How has the activity influenced the changes observed in the community?
- Has it made an important contribution to these changes?
- What role did the activity play in bringing about these changes?
It is not an appropriate approach when you need to prove the activity caused the change, or when you need to quantify the effects of an activity on a population group.
How to use it:
The following approach presents a streamlined version of contribution analysis, with the aim of supporting program and M&E teams to use this in humanitarian contexts:
- Step 1: Add assumptions and external factors to your project-specific theory of change
- Step 2: Gather and assess the existing evidence on results achieved
- Step 3: Assemble the contribution story, and challenges to it
- Step 4: Gather further evidence
- Step 5: Strengthen the contribution story
Step 1: add assumptions and external factors to your theory of change
Building off the theory of change approach outlined in Module 2, contribution analysis adds possible external factors for each step of the program logframe. For example, for the first row of the fictional logframe presented in diagram 8 above, the following possible external factors can be identified:
Diagram 10: External Factors
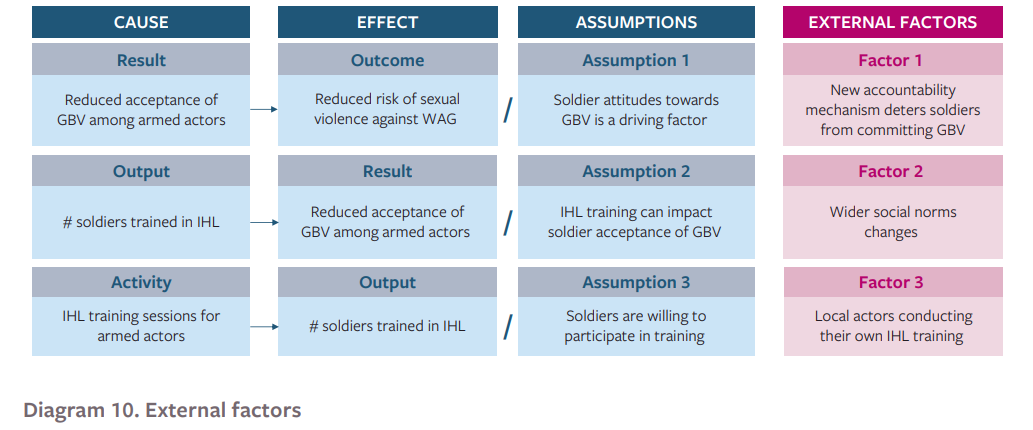
In each case, the external factor presents one way that the effect might be brought about without the activity happening at all. For example, even if the outcome of increased PSEA awareness/skills is not achieved, the impact of reduced instances of SEA might still happen if an external factor like the implementation of new accountability mechanisms by key NGOs. In this instance, even if awareness of risks is not raised, the presence of an adequate accountability might itself reduce the rate of sexual exploitation and abuse. Thus, this presents an external factor to the program that may influence the desired change.
It is important that, at this stage in the analysis, all the possible external factors driving the observed change are presented. This can be done by brainstorming with key program stakeholders to identify potential factors. But it is important that a range of possible factors are included at this stage.
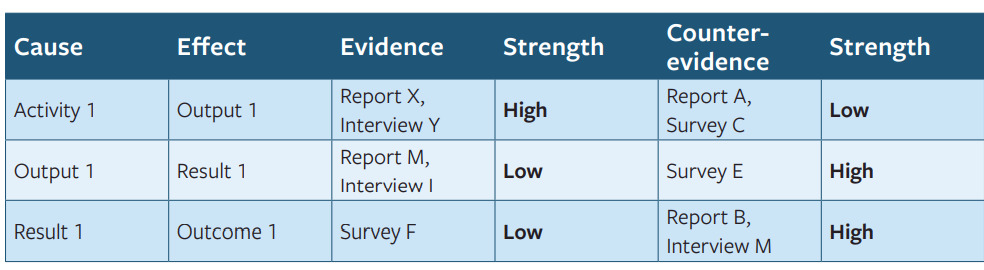
Step 2: gather and assess the existing evidence on results achieved
Review existing data against the revised theory of change. This step involves going through monitoring and program reports to identify evidence either for the claim that it was the program activity that led to the change observed, or for the claim that it was the external factor. Once this is done, the strength of the evidence can be assessed, so that for each step of the logframe, the M&E team have a collection of evidence for and against the claim that it was the program leading to the change observed:
Step 3: Assemble the contribution story, and challenges to it
Based on the evidence collected in step 2, ask what is the most likely story of how your activity contributed to the change you observed? How significant do you think the activity was in influencing the change now? What alternative stories of why the change happened are possible? What other factors might have influenced the change? This process is quite subjective, but transparency is the key, so that you can demonstrate how you reached the judgements you reach.
Step 4: Gather further evidence
Once this is complete, it is important to add primary data collection to the analysis. Go out and ask people about the contribution story, and its alternatives. Use interviews, focus groups, surveys, or other tools. Make sure that you consult a wide-range of project stakeholders and give them a chance to tell you how plausible your contribution story is. Ask about alternative explanations for the change you observed. And ask about how important your activity was for the change in the eyes of your stakeholders.
Step 5: Strengthen the contribution story
Based on the new evidence, refine your contribution story by explaining how much confidence you have that your activity led to the observed change. Try to demonstrate how big a role your activity had, and how big a role external factors also had on the change. This is often demonstrated using a logframe-style diagram, with thick arrows representing major influences on change, and thin arrows representing minor ones:
Diagram 11: Strengthening the contribution story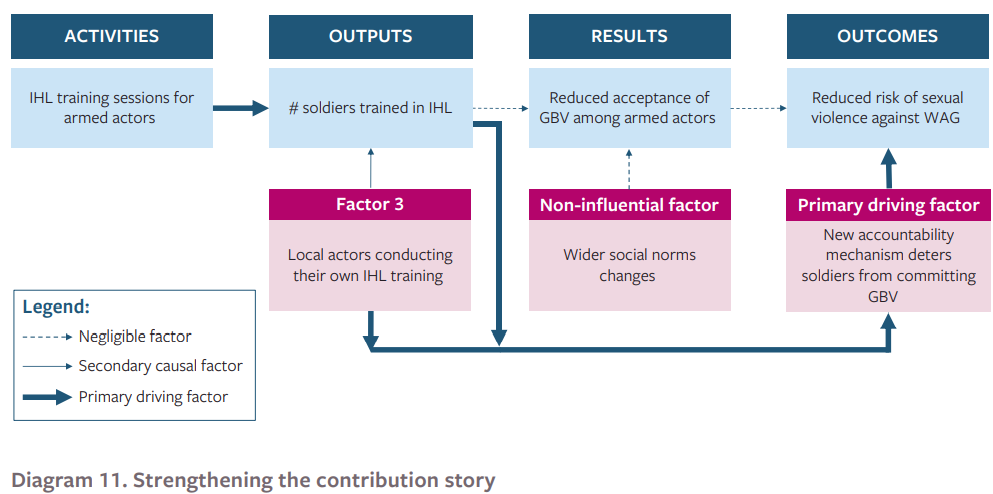
In this diagram, it is suggested that the program did have a significant influence on reducing the GBV risk for women and girls in the IDP camp, but not in the way originally intended. Whilst the IHL training failed to significantly shift the attitudes of soldiers towards GBV, the training did – in conjunction with other IHL training conducted by local actors – trigger senior members of the armed group to establish an accountability mechanism that deterred soldiers from committing GBV. That accountability mechanism itself proved to be a primary driving factor for the reduced risk faced by women and girls in the IDP camp. This would make sense given the strength of evidence identified for each step of this logframe in Step 2.
The benefit of doing this is that it helps to develop a more nuanced understanding of how the program influenced change and, crucially, how it interacted with external factors in the community, such as the local actor-led IHL training. This type of information can help project teams adapt for future funding cycles, and help communicate the rationale for project changes to donor organizations.
4.2.5 Process Training
What it is:
Process tracing is an approach to qualitative analysis that aims to determine the strength of evidence linking potential causes to an observed change. It is often used to help evaluate the contribution of advocacy campaigns to policy changes in development settings. It can be used together with the contribution analysis approach outlined above, to help determine the strength of the relations between different steps of the logframe in a more rigorous way.
How to use it:
Process tracing can be used in a variety of different ways, with typical approaches covering at least five distinct steps, starting with identifying a change that needs to be explained (e.g. the establishment of the new accountability mechanism by the armed actors described above), and ending with a statement of how influential the program activities were in bringing this about. For a full account of how to use process tracing – and some useful exercises to practice the technique – please see Collier, D. (2010). Process Tracing: Introduction and Exercises, which is available for free at: https://www.dmeforpeace.org/resource/process-tracing-introduction-and-exercises/
For the purposes of this framework, however, and bearing in mind the criteria outlined at the start of this Module, it is suggested that process tracing be approached as an add-on to the contribution analysis tool presented above. As such, evaluators should go through steps 1 – 4 of the contribution analysis tool first, before using process tracing in step 5 of the methodology.
Once the evaluator has reached step 4, above, they should have compiled the evidence for and against the claim that the program activities were influential for the results observed. And they should also have compiled evidence for and against the claim that other, external, factors, were influential instead. In step 5, the task is to assemble the contribution story according to an assessment of strong, medium or weak causal influences along the path to change (see the final logframe diagram in the previous section).
Instead of simply categorizing causal influence in this way, evaluators can use process tracing to add greater rigor the analysis of the causal claims. In particular, they can ask the following questions:
- Was the activity (e.g. the IHL training conducted by the program team) necessary for the outcome (e.g. the reduced risk of sexual violence against women and girls in the IDP camp)? In other words, if the activity had not have gone ahead, would the outcome still have come about?
- Was the activity sufficient for the outcome? In other words, once the activity did go ahead, was anything else needed for the outcome to occur?
By asking these two questions, the evaluators can categorize the influence of the program activity on the observed change in one of four ways:
- A straw in the wind: the activity was not necessary for the observed change, and it was not sufficient either. But it was potentially relevant to the change. An example here would be the IHL training and the GBV risk reduction outlined in diagram 10, above. The IHL training activity was not necessary for the change, since the local actor also conducted IHL training that had the same effect. Nor was it sufficient, since it would not have brought about a reduced risk if the armed actors had not decided to establish an accountability mechanism. But it was certainly relevant if, for example, the evaluators found credible reports from the armed actors that the training gave them reason to establish the accountability mechanism.
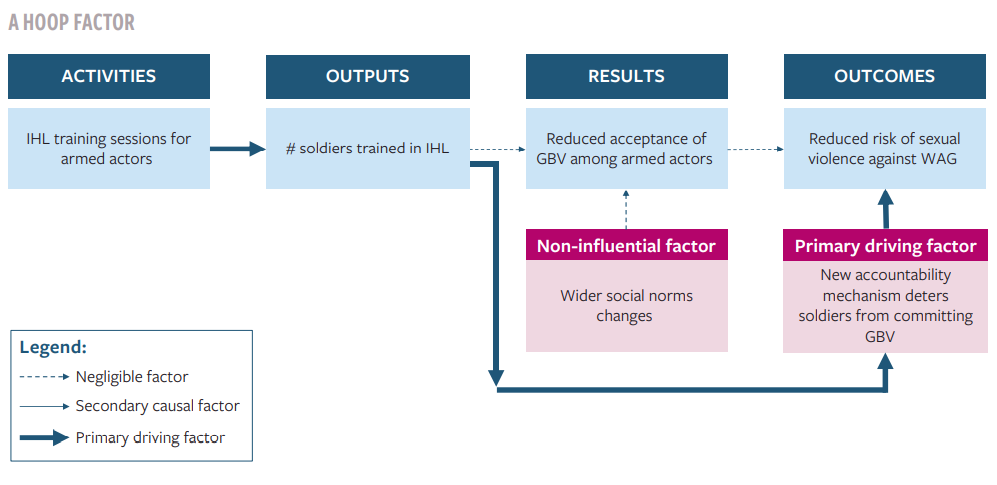
- A hoop factor: the activity was necessary, but not sufficient for the change. For example, if no local organization had conducted IHL training in the example above, then the program’s training would have been a necessary condition for the risk reduction, assuming of course that the reports from armed actors citing the training as the reason they established the accountability mechanism are credible. The training was still not sufficient though, since it would not have reduced the GBV risk had the armed actors attended the training but not established the accountability mechanism.
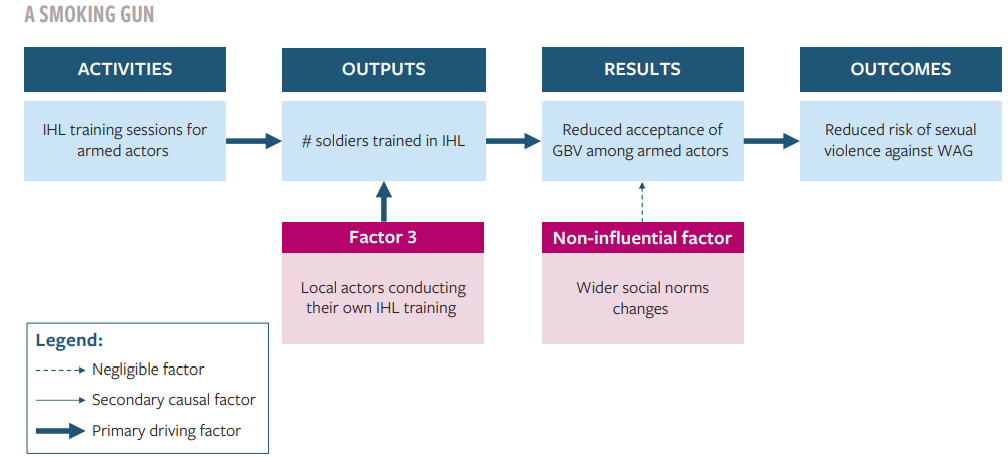
- A smoking gun: the activity was sufficient for the change, but it was not necessary. For example, if the IHL training had led directly to a reduced risk of GBV, without the need for an accountability mechanism being established, then the training would have been sufficient for the risk reduction. If this had been the case and other training had been provided by local actors, then the training would have been sufficient but not necessary.
- A doubly decisive factor: the activity was necessary for the change, and it was sufficient for it too. For example, if the IHL training had led directly to a reduce risk, without the accountability mechanism being established, and without any other training taking place, then the evaluators could argue that the training was both necessary and sufficient for the risk reduction.
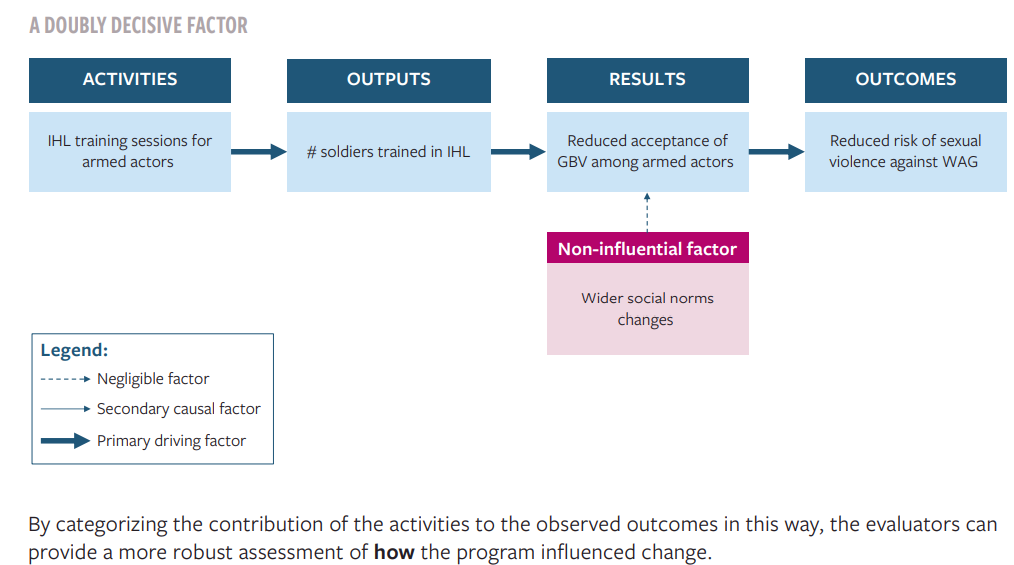
By categorizing the contribution of the activities to the observed outcomes in this way, the evaluators can provide a more robust assessment of how the program influenced change.
4.3. Making space for innovation
As discussed in the Introduction to this framework, the tools and approaches presented above have all been chosen in response to the needs and constraints felt by country teams conducting GBV prevention activities. These constraints include, as noted above, a severe restriction on available time and resource for planning and delivering high quality evidence about the effects of their programs. The short timeframes for project design, and the short funding cycles for implementation, all restrict the ability of program teams to monitor behavior change over time.
In the context of GBV prevention, this is especially problematic. Many types of GBV prevention can take place in the short-term: including immediate actions to intervene and stop sexual abuse or intimate partner violence at source. But longer-term change, including the type of social norm change that many organizations are targeting even in humanitarian contexts, does take time to emerge. As such, it is a pity if we restrict ourselves to only those tools and approaches that can be implemented within the constraints project teams currently face.
For this reason, the authors present below a brief list of potential areas for development in the measurement of GBV prevention. These areas were identified during the preparatory work for this framework, which included online workshops with 7 organizations operating GBV and protection activities in 6 different crisis contexts, as well as 1-2-1 interviews with 104 different team members from both program and M&E departments.
- Invest in medium-term evidence windows. The data collection tools outlined above were initially designed for development contexts and deployed for programs lasting several years. By restricting data collection to the length of current project cycles, we are significantly reducing our capacity for learning about what contributes to change in GBV risk. Instead, donors and implementing agencies could work together to build 3-5 year evidence windows. By providing a separate funding window for monitoring and evaluation of GBV prevention activities, untied to individual program cycles, this approach could allow NGOs and partner agencies to contribute to wider knowledge and learning for GBV prevention. Utilizing a consortium model would allow the M&E activities to benefit from economies of scale. If the relevant actors (possibly including agencies and country cluster coordinators) are willing to work together, this type of model could be replicated within a 12 – 24 month project cycle, or potentially even linked to the country-level Humanitarian Program Cycle. Consortia models have been deployed over longer timeframes in humanitarian settings before, for example, the M&E model used by the Lebanon Cash Consortium to provide evidence on the impact of the multi-purpose cash assistance provided in response to the Syrian refugee crisis in Lebanon https://resourcecentre.savethechildren.net/library/lebanon-cash-consortium-lcc-impact-evaluation-multipurpose-case-assistance-programme. Likewise the UKAID-funded program What Works in Preventing Violence Against Women and Girls took a similar model. Replicating this type of approach for more GBV prevention work will help to build a nascent but growing evidence-base.
- Make use of developmental and embedded evaluation approaches. Developmental evaluation is an approach to evaluation that emphasizes supporting the process of program innovation and adaptation. It is especially useful when program teams do not expect to know how to solve the problems they are trying to tackle at the program outset. Developmental evaluation usually entails embedding M&E teams inside project teams, and focusing on providing informal feedback on what is working and what could be done differently. It differs significantly from traditional evaluation and typically struggles when attempted in an organizational context where significant accountability requirements are placed on M&E systems. It typically doesn’t help answer questions about how the program has delivered against a logframe. And it typically does require additional resources and investment in the M&E system. But it has the capacity to support learning and innovation in an area, like GBV prevention, where we still have much to learn. As such, donor and implementing organizations wishing to advance our understanding of what works in this field, and trial new and innovative approaches, would be well-placed considering developmental evaluation approaches. To learn more about this approach, please see:
- Dillon (2019). Breaking the Mould: Alternative approaches to monitoring and evaluation. London: ODI/ALNAP. file:///C:/Users/n_dil/Downloads/ALNAP%20Breaking%20the%20Mould_paper%20(2).pdf
- Dozois, E., Langlois, M. and Blanchet-Cohen, N. (2010) DE 201: a practitioner’s guide to developmental evaluation. Victoria: British Columbia: J.W. McConnell Family Foundation and the International Institute for Child Rights and Development. https://mcconnellfoundation.ca/assets/Media%20Library/Publications/DE%20201%20EN.pdf
- USAID (2017) Learning from practice: developmental evaluation in practice: tips, tools, and templates. Washington, DC: USAID https://www.usaid.gov/sites/default/files/documents/15396/USAID_DEPA_MERL_Developmental_Evaluation_in_Practice-_Tips_Tools_and_T.pdf
- Leverage new technologies to build the evidence about the correlates of GBV risks. The proxy indicator approach outlined in Module 3 requires program teams to make assumptions about what goes hand-in-hand with GBV risk. When done intentionally, and transparently, this can generate useful findings about how GBV risk has evolved through a crisis. But there does remain a significant gap in our knowledge about what does correlate with GBV risk in humanitarian contexts. Donors and agencies wishing to improve on the evidence-base could consider investing in the use of new data analytics and big data collection tools to help map the correlates of GBV risk. While these approaches cannot be approached lightly, and come with significant ethical concerns, and of course entail serious engagement with the responsible data management paradigm, a serious and careful engagement with these tools could help GBV program teams to draw on a wider bank of empirically-tested proxy indicators for their own programming, without having to make assumptions of their own.
Our hope is that strategic investment in these areas will help to improve the quality of evidence about what works for GBV prevention in humanitarian contexts, so that future programs can be designed on this basis. Combined with an improved project-level monitoring and evaluation system for these projects, in line with the approach outlined in this framework, we consider that the quality of results-based outcome-oriented programming can be significantly raised for those most vulnerable to gender-based violence in crisis contexts.